
What was the challenge?
Its early campaigns were generating sales, but the account was small and not structured to grow.
Case study / Meta Ads / Online grocery
WB Groceries is a grocery retailer in the United States, and we ran its Meta Ads. In February 2025 the account spent $28,364 for $60,546 in purchase value, against $3,459 and $7,972 in July 2024: 7.6 times the monthly value on 8.2 times the spend, with ROAS still above 2.
From Meta Ads Manager, July 2024 and February 2025.
01 / The results
From the client's own Meta Ads Manager, July 2024 and February 2025. Purchase value is what Meta attributes to the ads, not total revenue.
$7,972 in July 2024 to $60,546 in February 2025.
$3,459 to $28,364 a month, paid by the client to Meta.
Slightly lower at the bigger scale, still above 2.
Purchase value from $28,364 in ad spend.
02 / The challenge and the work
Where the client started, what we changed and what the figures show.
Its early campaigns were generating sales, but the account was small and not structured to grow.
We simplified the campaign structure around the strongest product categories, improved product-focused creative and offers, used purchase data to find and scale the winning audiences and ads, improved the website journey to help more ad visitors complete their orders, and moved budget gradually toward the campaigns already proving they could sell.
In July 2024 the account spent $3,459 on Meta for $7,972 in purchase value (ROAS 2.30). In February 2025 it spent $28,364 for $60,546 (ROAS 2.13): 7.6 times the monthly purchase value on 8.2 times the spend, with ROAS still above 2, according to Meta Ads Manager.
It was nice having a team that could handle the online side without us having to worry about every small thing. Whenever we needed an update or had a question, they responded quickly.
03 / The proof
Straight from the client's own Meta Ads Manager, cropped to the figures and watermarked, with the totals highlighted. Nothing retyped or rounded.
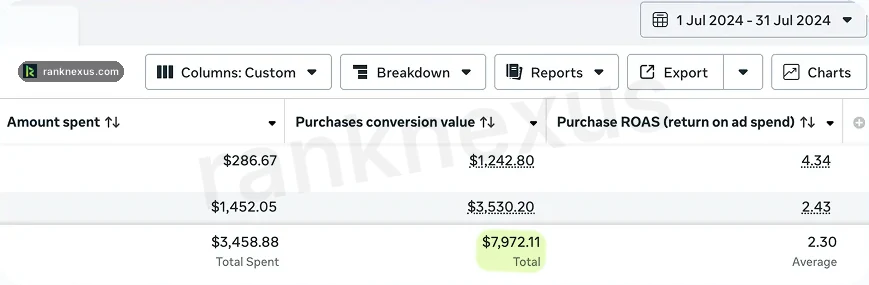
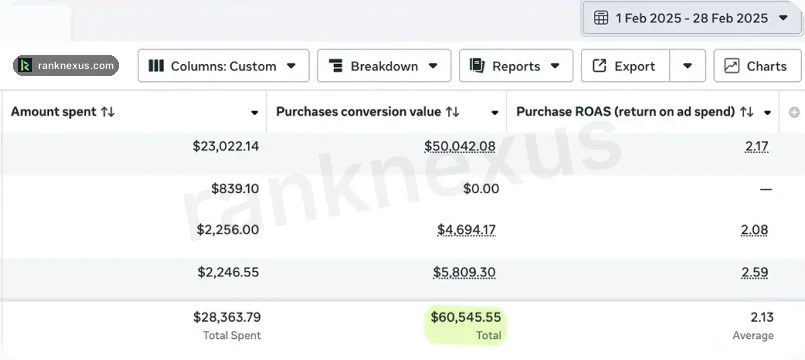
Source: Meta Ads Manager, the client's ad account (July 2024 and February 2025). Purchase value is what Meta attributes to the ads, not the store's total revenue.
Purchase value is what Meta attributes to the ads, not the store's total revenue.
ROAS was slightly lower at the larger scale (2.30 to 2.13); profit depends on margins not shown here.
One line in the February table spent $839.10 with no purchase value recorded ($0.00).
The July screenshot shows the first two rows of the July table; its total row covers all of them.
This is one client's result over the dates shown, not a forecast or a typical result for another business.
What this means for your business
A small account that sells can grow if budget moves step by step to the campaigns already proving they sell. Purchase data, product-focused creative and a smoother path to checkout did the rest.
Meta Ads Manager counts the purchases and leads it attributes to the ads; orders, margins and revenue sit in the client's own systems. This is a record of one client's result, not a forecast for yours.
About these results
No. It's the value of purchases Meta attributes to the ads, not the store's total revenue, and profit depends on margins not shown here.
Return on ad spend: purchase value divided by ad spend. Meta Ads Manager shows 2.30 for July 2024 and 2.13 for February 2025.
We simplified the campaigns around the best-selling categories, improved product creative and offers, used purchase data to scale the winning audiences and ads, improved the website journey and moved budget gradually to what was already selling.
No. This is one client's result over the dates shown, not a forecast. Results depend on your market, your competition, your website and your budget.
We can't promise numbers, but we can review your current ads, audiences and lead path for free and send a recorded 10-minute walkthrough within 2 business days.
A useful next conversation
Tell us about your offer and goals, and our team will send a written proposal. Or ask for a free audit of your Meta Ads first.